Unique insight into financial data of Baltic & Nordic companies

Make data-driven investment decisions with most comprehensive, easy-to-use, intuitive and interactive financial analytics

Dive deeper

Why you need and have to choose us?

Our collected comprehensive financial data and business intelligence reports allow to analyze and compare companies from every angle – better, easier and faster.

17 years of as-reported financial data

We collect our data directly from companies’ reports. Use the most complete, comprehensive and reliable data.

Demo Preview
KPIs, segments & alternative performance metrics

We provide information, that is unavailable on other platforms. See, what other can’t.

Demo Preview
Trading, ownership and insiders’ activity statistics

See, what the main shareholders, insiders and trading counterparties (brokers) are doing in the market.
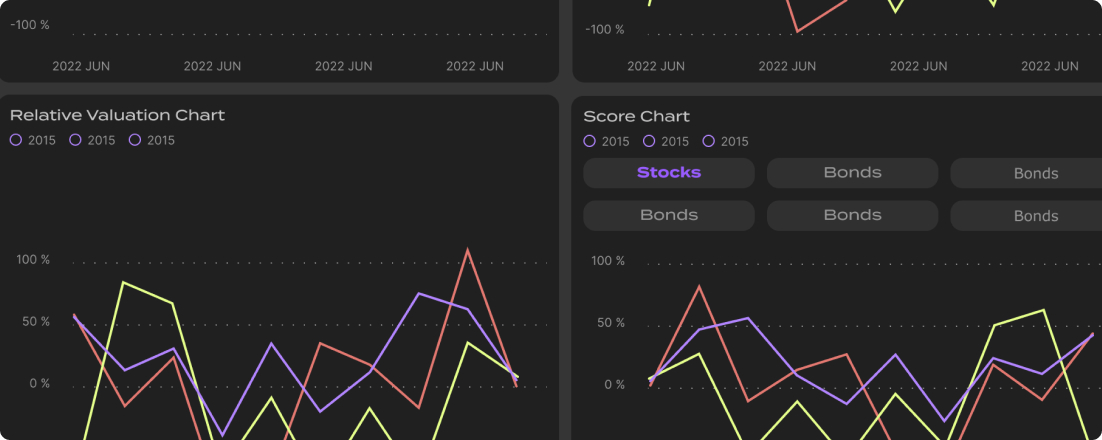
Demo Preview
Scoring system for identifying best companies

Find attractive investment opportunities with our scoring system. Rank. Choose. Invest.

Demo Preview
Discover undervalued stocks with our valuation model

Looking for undervalued companies? Find the best value opportunities with our relative valuation model.

Demo Preview
Predefined investment portfolios and strategies

Are short of your own investment ideas? Choose from our variety of predefined (selected) portfolios and strategies.

Demo Preview
Dashboard with more than 50 financial metrics and ratios

All you need for quick and effective evaluation of any company. Increase your research productivity.

Demo Preview
Interactive charts for all metrics with data export feature

A good chart is worth a thousand words. Use our charts with multiple selection option to create your investment stories.

Demo Preview
Screen and compare companies by any metric

Separate the “wheat” from the “chaff” with our screening and comparison tools. Find your investment gems.

Demo Preview
Source documents for every financial number

Check easily every number we provide. Find all company’s reports in one place.

Demo Preview
Details for specific items of costs, assets and liabilities

Dive deep into the data as much as possible. We provide unmatched depth of financial data.

Demo Preview
Customized analytics, tailored to your specific needs

Need some specific valuation multiples or analytical reports? Contact us and we will customize analytics specially for you

Demo Preview

Venenatis vitae morbi leo.

Non at suspendisse vel, mi, quam vitae. Non nullam facilisis eget egestas. Gravida etiam amet et nunc, viverra aliquet venenatis. Lacus commodo neque pellentesque orci amet. Facilisi nisi odio egestas egestas commodo diam dui ipsum in. Dictum interdum.

Automatically selected investment portfolios & strategies

To help support your investment decisions and generate new ideas, we defined a broad variety of model investment portfolios and strategies. Each portfolio is generated automatically by wholly objective rules and algorithms. Select portfolio and view its composition.

Demo Preview

Strategies

Automatically selected investment portfolios and strategies

Ratios

Screen and compare companies by any metric

Data depth

Take advantage of unmatched data depth

Statistics

Trading, ownership and insiders’ activity statistics

Charts

Interactive charts for all metrics with data export feature

Evaluation

Dashboard with more than 50 financial metrics and ratios

Choose best companies with our scoring system

PLY scoring is a ranking system that reflects relative investment attractiveness of companies. System is based on five key financial aspects (areas):

Valuation Growth Profitability Financial strength Free cash flow

Each of these components is also ranked based on most important fundamental metrics. Total Score is calculated as a simple average of these components’ ranks. Total Score ranges from 0 to 10, with 10 as a highest rank that reflects most attractive companies from investing perspective.

Discover undervalued stocks with our relative valuation methodology

PLY provides Fair Value estimations for company’s equity (stock) and compares it to actual Market capitalization. Respectively, Valuation Gap is calculated for every company’s stock as a difference between actual Market Cap and Fair Value. Negative Valuation Gap indicates that company’s stock is undervalued compared to its calculated Fair Value. Positive Valuation Gap indicates that company’s stock is overvalued compared to its calculated Fair Value.

Fair Value calculations based on relative valuation principles using these metrics:

Possibility to choose various investment strategies

Non at suspendisse vel, mi, quam vitae. Non nullam facilisis eget egestas. Gravida etiam amet et nunc, viverra aliquet venenatis. Lacus commodo neque pellentesque orci amet. Facilisi nisi odio egestas egestas commodo diam dui ipsum in. Dictum interdum.

Package to suit your plan

Tax’es included. 14 day money back guarantee. Cancel, downgrade or upgrade at any time

Annually you have 16% off which is 2 months free

Basic

0.00

Get familiar with platform. No credit card requider.

Start Today
View detailed pricing options
  • Scoring system for identifying best companies
  • Discover undervalued stocks based on our relative valuation methodology
  • Dashboard of more than 50 financial metrics and ratios
  • 17 years of data
  • Interactive charts for all metrics
  • Comliare all comlianies by any metric
  • Export data
  • Predefined investment portfolios
  • Screen markets by all metrics an ratios

Professional

8.99 € / month / market

Markets 1
Start Today
View detailed pricing options
  • All free features
  • Comprehensive as-reported financials of every company
  • Source documents for every financial number
  • Details for specific items of costs, assets and liabilities
  • Segment information
  • KPIs and alternative performance metrics
  • Ownership structure and its changes
  • Insiders' ownership and trading
  • Comprehensive trading statistics

Enterprise

Custom

For organizations with special requirements

Start Today
View detailed pricing options
  • Can't find your preferred financial ratios in our toolkit?
  • Need some additonal valuation multiples to value your stocks?
  • Want to compare companies by additional metrics?
  • Have specific requirements for analytical reports?
  • Need special pricing for more users?
  • Contact us and we will customize analytical reports to tailor your special needs!

Take your investment analysis to the next level

Practical and structured approach to financial analysis and intelligent investment decisions making. How to choose correctly from hundreds and even thousands of stocks? How to evaluate financials of any given company as quickly and efficiently, as possible? How to read financial statements and find undervalued companies?

Let’s find out

Neque odio at viverra viverra quis.

Tax’es included. 14 day money back guarantee. Cancel, downgrade or upgrade at any time

Vestibulum a nec duis mauris ullamcorper. Sit.

Lobortis viverra a, maecenas eu lectus nisl consectetur placerat metus. Ac in neque scelerisque senectus. Furpis et sollicitudin eget. Iaculis odio.

Sem sed felis duis fringilla nascetur. Nisl.

Vestibulum a nec duis mauris ullamcorper. Sit.

Lobortis viverra a, maecenas eu lectus nisl consectetur placerat metus. Ac in neque scelerisque senectus. Furpis et sollicitudin eget. Iaculis odio.

Sem sed felis duis fringilla nascetur. Nisl.

Vestibulum a nec duis mauris ullamcorper. Sit.

Nulla fusce faucibus nunc libero. Aliquam venenatis, porttitor congue hendrerit faucibus integer nec tellus.

Demo Preview
Vestibulum a nec duis mauris ullamcorper. Sit.

Lobortis viverra a, maecenas eu lectus nisl consectetur placerat metus. Ac in neque scelerisque senectus. Furpis et sollicitudin eget. Iaculis odio.

Sem sed felis duis fringilla nascetur. Nisl.

Neque odio at viverra viverra quis.

Hac consequat hac mus egestas. Etiam amet donec viverra amet morbi integer eget faciazlisis orci. Leo fermentum ac elementum, lacus, tempor neque. Tellus aliquam justo varius elit consequat nullam accumsan praesent.

What do users say about us?

Hac consequat hac mus egestas. Etiam amet donec viverra amet morbi integer eget facilisis orci. Leo fermentum ac elementum, lacus, tempor neque. Tellus aliquam justo varius elit consequat nullam accumsan praesent.

4 days ago

Lobortis viverra maecenas.

Eget mauris odio sollicitudin velit a, eleifend in fames. Sit laoreet risus consequat cras.

Lobortis viverra

4 days ago

Lobortis viverra maecenas.

Eget mauris odio sollicitudin velit a, eleifend in fames. Sit laoreet risus consequat cras.

Lobortis viverra

4 days ago

Lobortis viverra maecenas.

Eget mauris odio sollicitudin velit a, eleifend in fames. Sit laoreet risus consequat cras.

Lobortis viverra

4 days ago

Lobortis viverra maecenas.

Eget mauris odio sollicitudin velit a, eleifend in fames. Sit laoreet risus consequat cras.

Lobortis viverra